Calculate Type-to-Token Ratio (TTR)
In a book or corpus, some words are used frequently (e.g., and, of, the) while others are used only a few times. Lexical diversity statistics (like TTR) measure the vocabulary of a book, section, or corpus.
- Types refer to the unique words. There are 4 types in the phrase "The cat in the hat."
- Tokens refer to the total number of words. There are 5 tokens in the phrase "The cat in the hat."
Type/Token Ratios
There are many metrics used to calculate lexical diversity, but the most commonly used is TTR (Type to Token Ratio). This is a metric to use when comparing texts of similar lengths.
If you have texts with varying lengths, TTR is not as useful because longer texts will have more of the same words repeated over and over, thus lowering the TTR. We recommend the Moving Average Type/Token Ratio (MATTR), which can compare different sizes of texts more easily. You can also see the ups and downs of MATTR with our MATTR Visualization tool.
Calculating Type/Token Ratios
You won't have to calculate these statistics yourself—WordCruncher will compute several of these statistics for you so that you can analyze the lexical diversity of the text. As an example, we will compare the TTR statistics for two books by Brandon Sanderson: Skyward and Starsight.
- Open the book(s) to analyze.
- Open the Phrase Compare report.
- Select the name of Book 1. If you are comparing 2 books, select the name of Book 2.
- Click
Compare. - Click the
Σ(sigma) symbol.
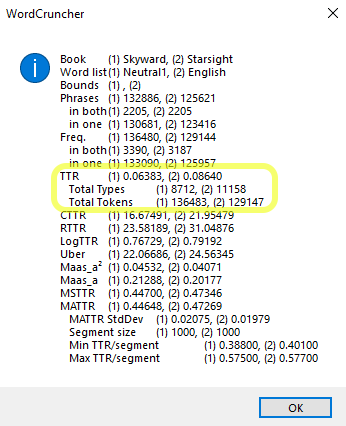
This menu displays many statistics, but let's focus on TTR (type/token ratio). Book 1, Starsight, has a TTR of 0.087, while Book 2, Skyward, has a much lower TTR of 0.064. Despite having a higher number of tokens, there are far fewer types in Skyward. Based on TTR (and other statistics, if you wanted to consider those), it appears that Skyward has a lower lexical diversity than Starsight does.
All Statistics
As mentioned above, TTR is just one of the statistics that you can use to measure lexical diversity. Below, you will find introductory information about each of the statistics generated by the Phrase Compare report.
Type/Token Ratios
| TTR | Type/Token Ratio | \[TTR = \frac{types}{tokens}\] |
| RTTR | Root Type/Token Ratio | \[RTTR = \frac{types}{\sqrt{tokens}}\] |
| CTTR | Corrected Type/Token Ratio | \[CTTR = \frac{types}{\sqrt{2\times{tokens}}}\] |
Logarithmic Measures
| LogTTR | Log Type/Token Ratio (LogTTR) | \[LogTTR = \frac{{log_{10}}({types})}{{log_{10}}({tokens})}\] |
| Maas_a2 | A statistic proposed by Heinz-Dieter Maas using log10 | \[a^2 = \frac{{log_{10}}({tokens})-{log_{10}}({types})}{({log_{10}}({tokens}))^2}\] |
| Maas_a | Square root of Maas_a2 | \[a = \sqrt{a^2}\] |
| Uber | Similar to Maas_a2 | \[\frac{({log_{10}}({tokens}))^2}{{log_{10}}({tokens})-{log_{10}}({types})}\] |
Equal Segment Measures
| MSTTR | Mean Segmental Type/Token Ratio Average TTR for each non-overlapping segment of equal size. | Sum of the complete segment TTRs divided by the number of complete segments |
| MATTR | Moving Average Type/Token Ratio Average TTR for all possible overlapping segments of equal size. A good statistic for looking at the type/token ratio across an entire text. | Sum of the complete segment TTRs divided by the number of complete segments. |
For more information about type/token ratio statistics, view this Phrase Compare TTR Statistics pdf.