Frequency Distribution Report: Rating Column
Understand your search results
The frequency distribution report is a tabular report that is displayed anytime you do a search. One of the columns in this report, rating, allows us to determine large differences in frequency across the book. By default, the report will show three columns: actual, rating, and actual/expected.
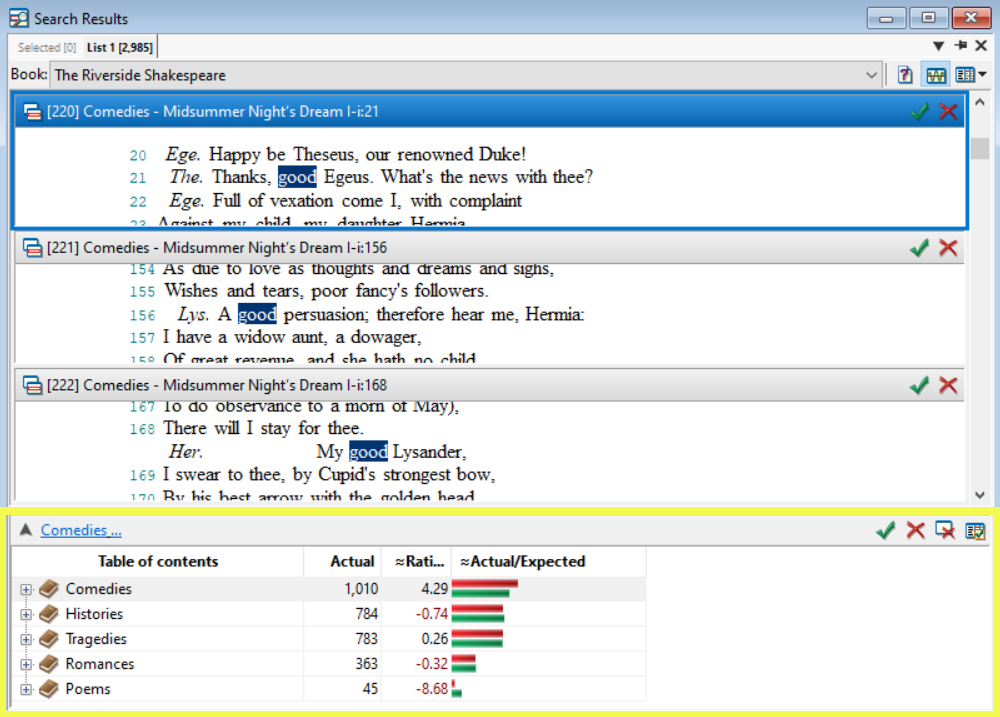
Note: You can customize the columns displayed by right-clicking on the column header, selecting Show or Hide Columns, and "checking" the columns you would like to display.
Queen in Shakespeare
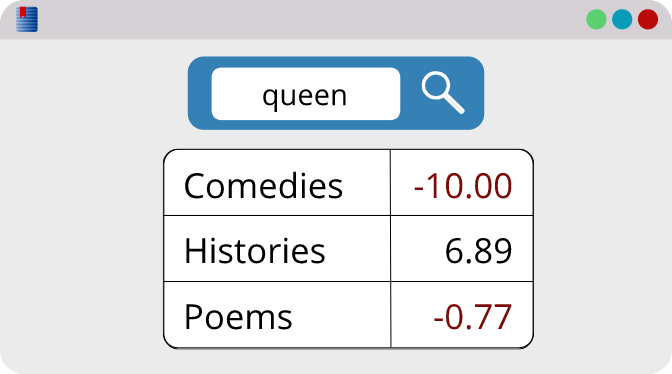
In The Riverside Shakespeare, the frequency distribution report shows that queen appears most in histories and least in poems, but each genre in this book is a different size. When comparing sections, we can use the rating column to determine differences based on the normalized frequencies.
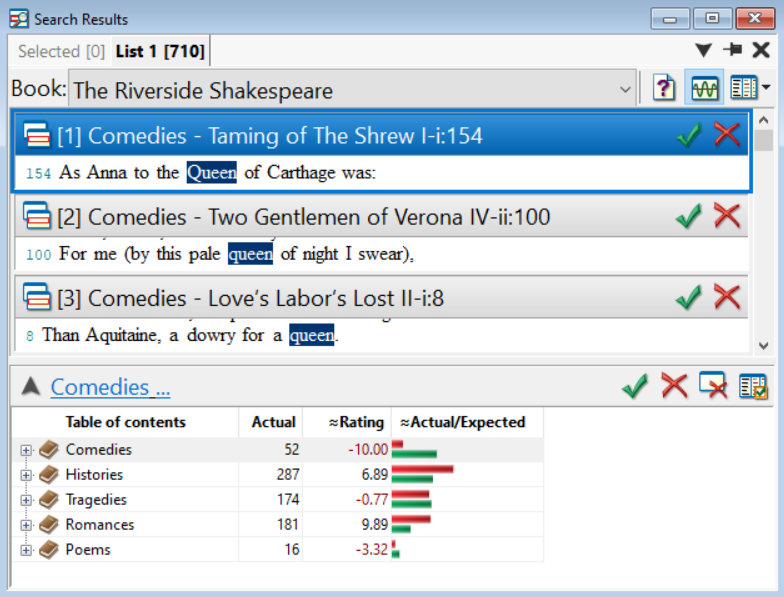
The rating column provides a number between -10.0 and 10.0. It quantifies the differences between the number of search hits in each reference and attempts to normalize the data by taking into account the size of the reference and the number of search hits found in it.
Simple analysis
When you look at the rating column, you'll notice that comedies show the lowest rating: a -10.0. This is because the word queen appears much less in comedies than you would expect to see based on the normalized frequency. Poems show a rating of -3.32 which still indicates less than you would expect to see, but it isn't as notable as the small number of hits appearing in comedies. And although queen appears most in histories (with a rating of 6.89), the genre with the highest rating is romances (a rating of 9.89), in which queen appears much more than the expected amount.
The closer a rating is to 10.0, the higher the actual frequency is in comparison to the expected frequency.
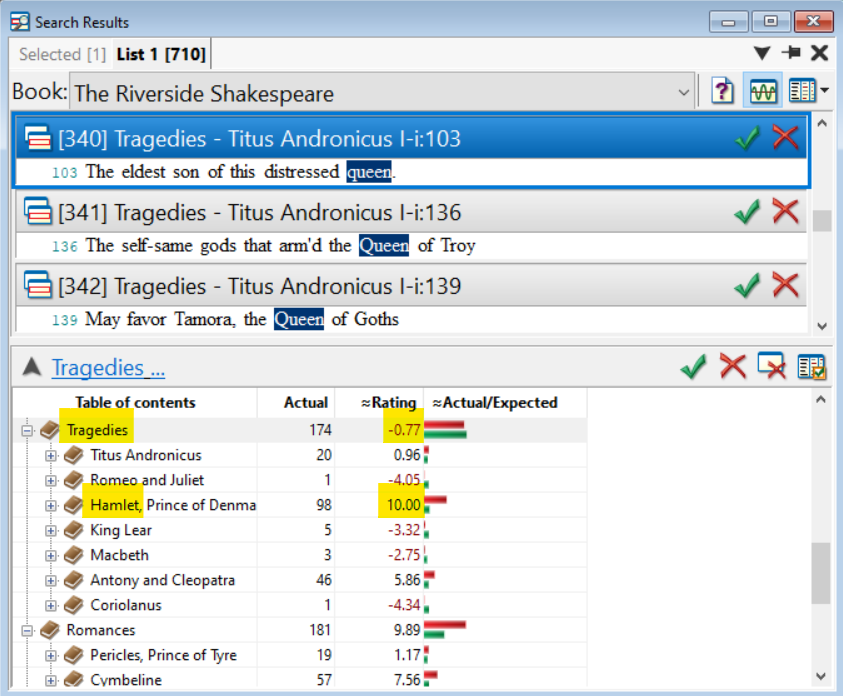
The rating column provides an easy way to quickly analyze large amounts of data. If you were to skim the same report with lower levels showing (individual plays), you can quickly understand more about sections of your text. For example, although queen has a rating of -0.77 in tragedies (meaning that it's barely less than the expected number), Hamlet seems to be an exception: a 10.0 rating.
Additional information
This formula is used to calculate the rating:
\[Rating = \sqrt{(Actual-Expected)^2 \over Expected + 1}\]
This formula is similar to calculating a chi-square statistic for each cell in a table.
To avoid dividing by 0, a 1 is added to the Expected value.
Ratings greater than 10.0 are rounded down to 10.0.
Ratings less than -10.0 are rounded up to -10.0.
The expected values used in computing this rating are from Normal type words in the All Text (excluding any text from your notes).
Note: If you have filters on your search query, the expected frequency will be inaccurate.