Vocabulary Dispersion
Many frequency dictionaries include not only a word's frequency but also its dispersion. You can learn a lot about a word from its frequency and dispersion throughout a text.
Open the Report
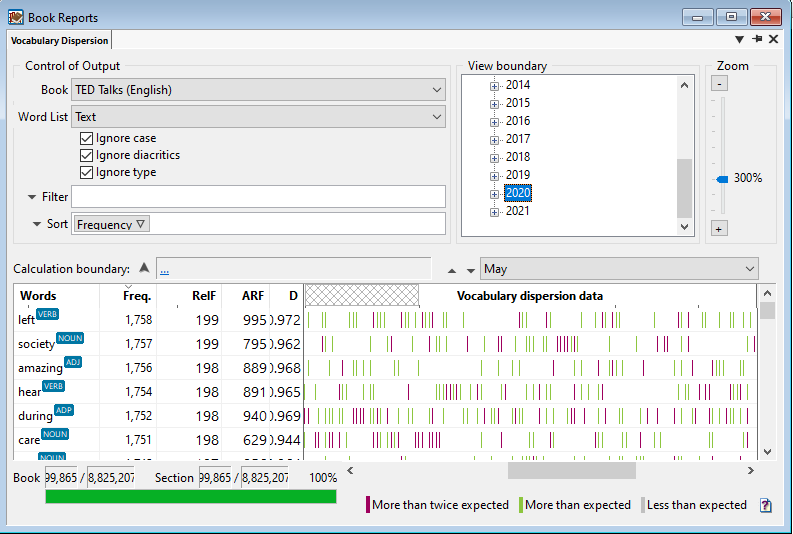
Go to Analyze > Book Reports > Vocabulary Dispersion Report
Absolute Frequency
Absolute frequency is the total number of times a word appears in a text. The more times it appears, the more important the word is. Language learners often use the most frequent words to guide their learning, while editors use the least frequent words to identify typos.
Statistics
Look for the Freq and SectF columns to see a word's absolute frequency.
The values in SectF will be the same as the Freq values if you're not analyzing a specific
section of the text.
Normalized Frequency
When comparing a word's frequency between texts, the texts often consist of different sizes. The normalized frequency estimates how many times each word would occur if the book or corpus contained exactly one million words.
Statistics
Look for the RelF column to see a word's normalized
frequency.
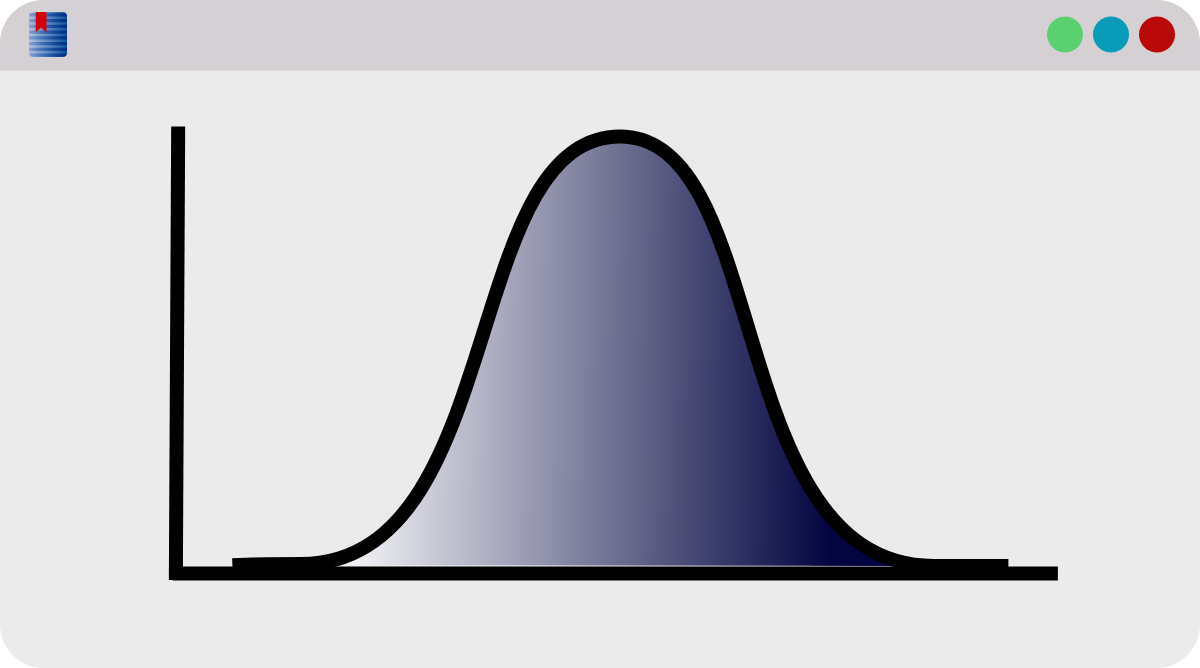
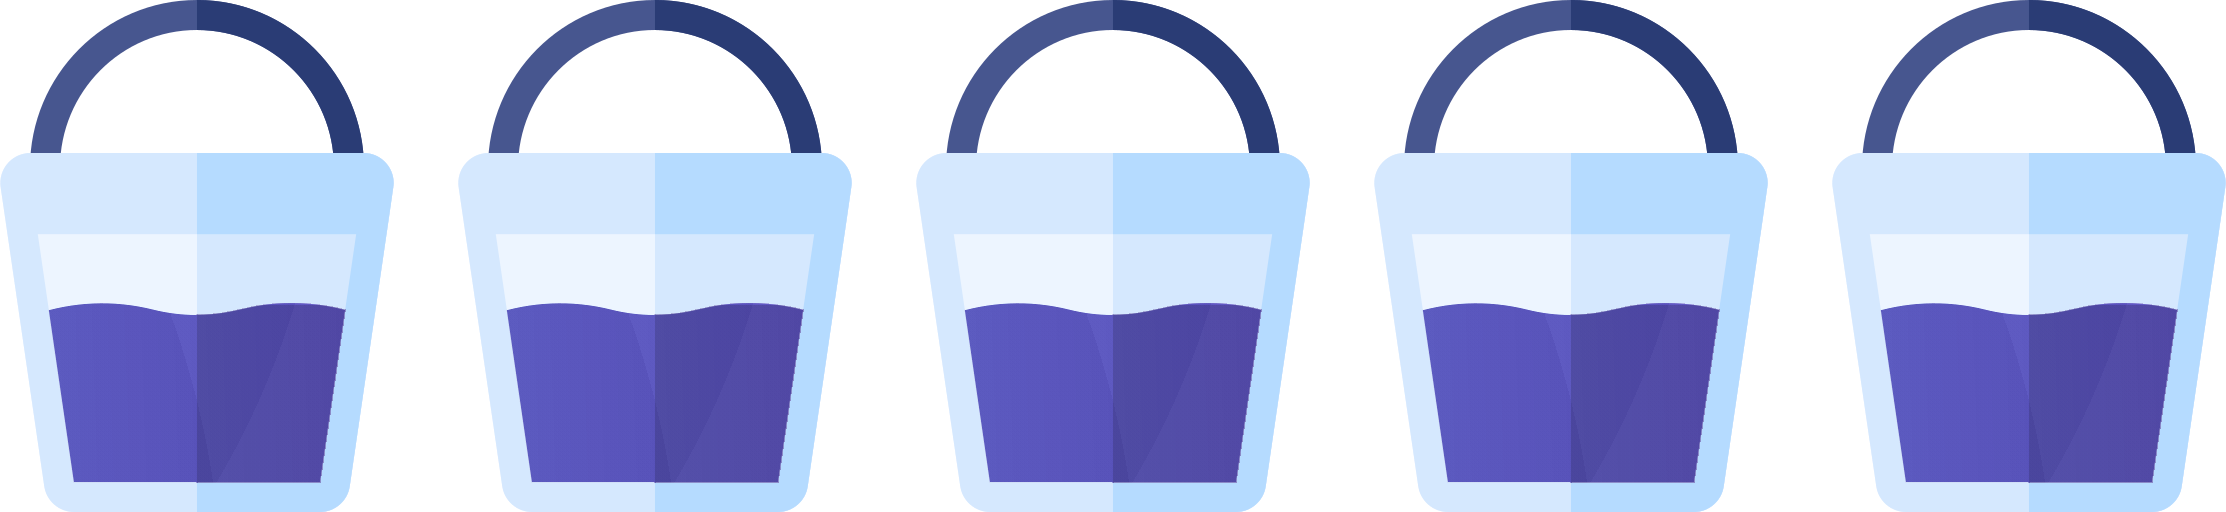
Even Dispersion
Imagine each text is divided into five buckets. If a word occurs 100 times in each bucket, its dispersion is evenly dispersed. From this, you'll know that the word is important throughout the entire text.
Marks
In WordCruncher, the words within these buckets are called marks. By default, a mark consists of 2,000 words. In the report, each vertical line represents a single mark.
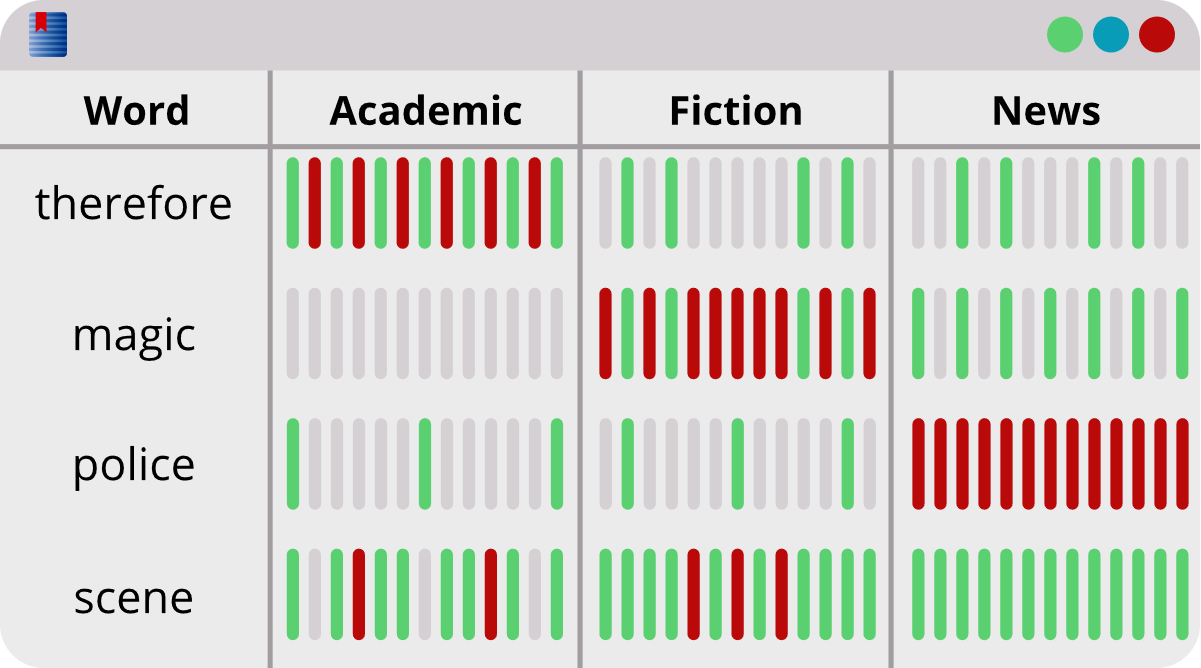
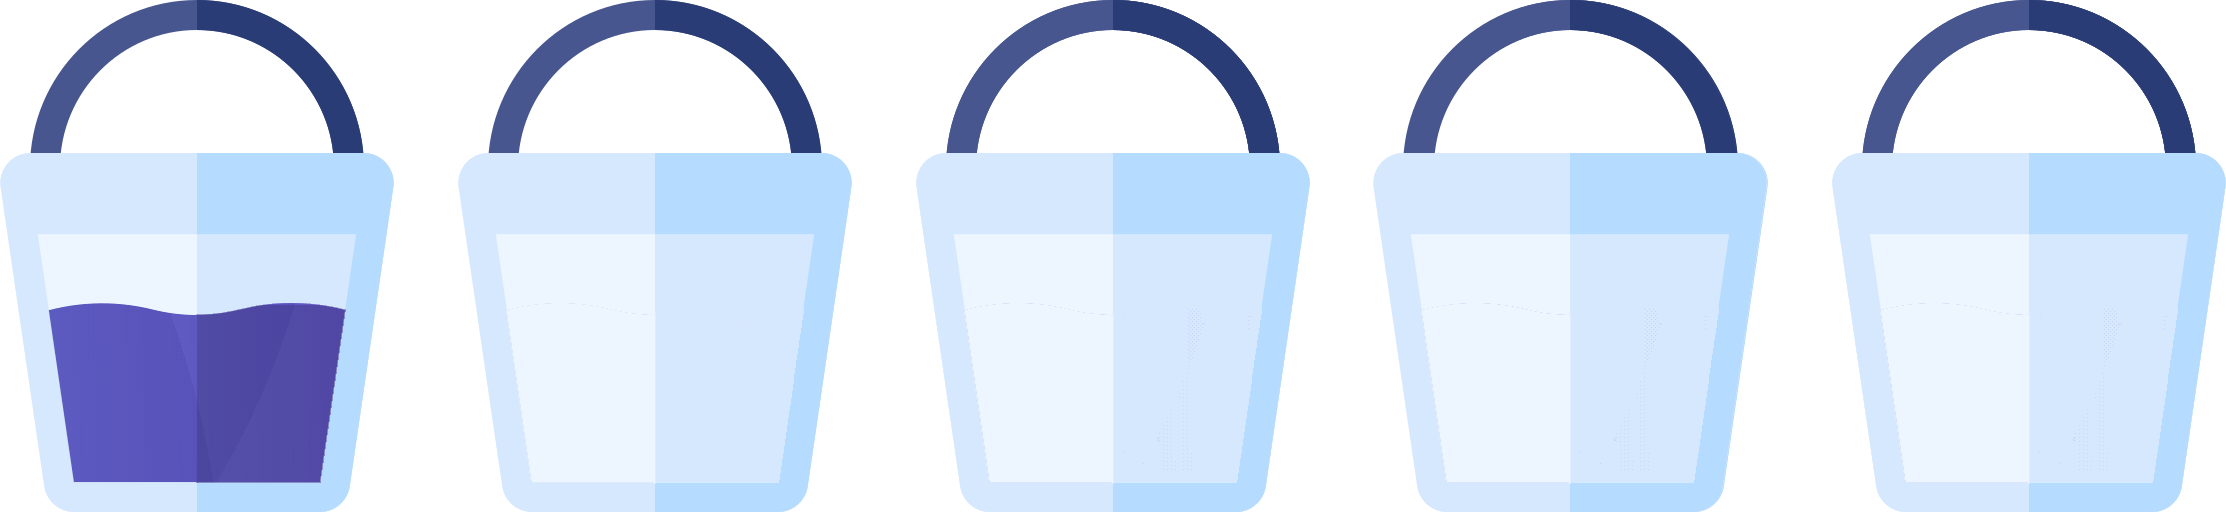
Uneven Dispersion
Some words only occur in one section, so even though one bucket is full, the rest may be empty. This means the word is important for only a section of your text.
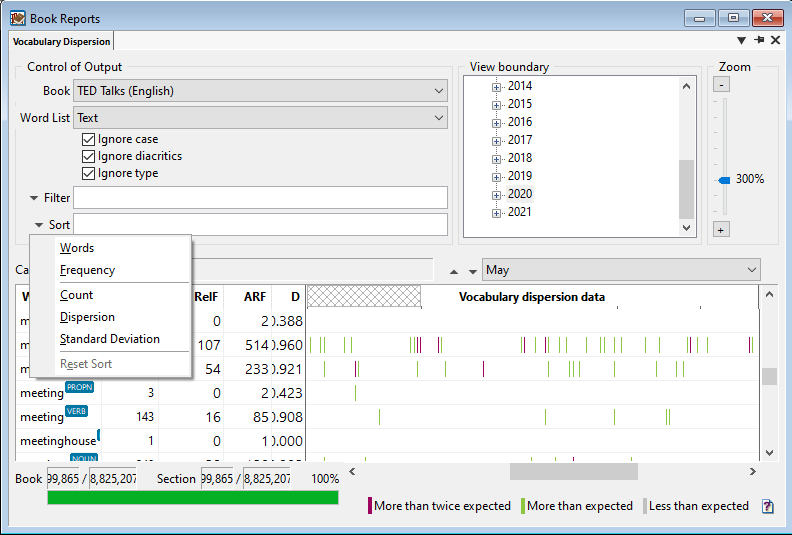
View Boundary
Within the View Boundary window, you can view a specific section of your text. Here, we have selected '2020.'
Below the View Boundary window, you can select subsections. Here, we have selected 'May.'
Along the top of the Vocabulary Dispersion data window, you can see a latticed section. This is the subsection of the text. In this example, the lattice represents 'May 2020.'
Filter and Sort
Filter by word or frequency.
Sort by word, frequency, count, dispersion, and standard deviation.
Dispersion Statistics
Learn more about the way that vocabulary dispersion is calculated.