Frequency Distribution Report
Find...
- the frequency of search terms within a reference
- the expected frequency of search terms compared to the actual frequency
- statistical ratings of the frequency
- and more!
Navigate the Report
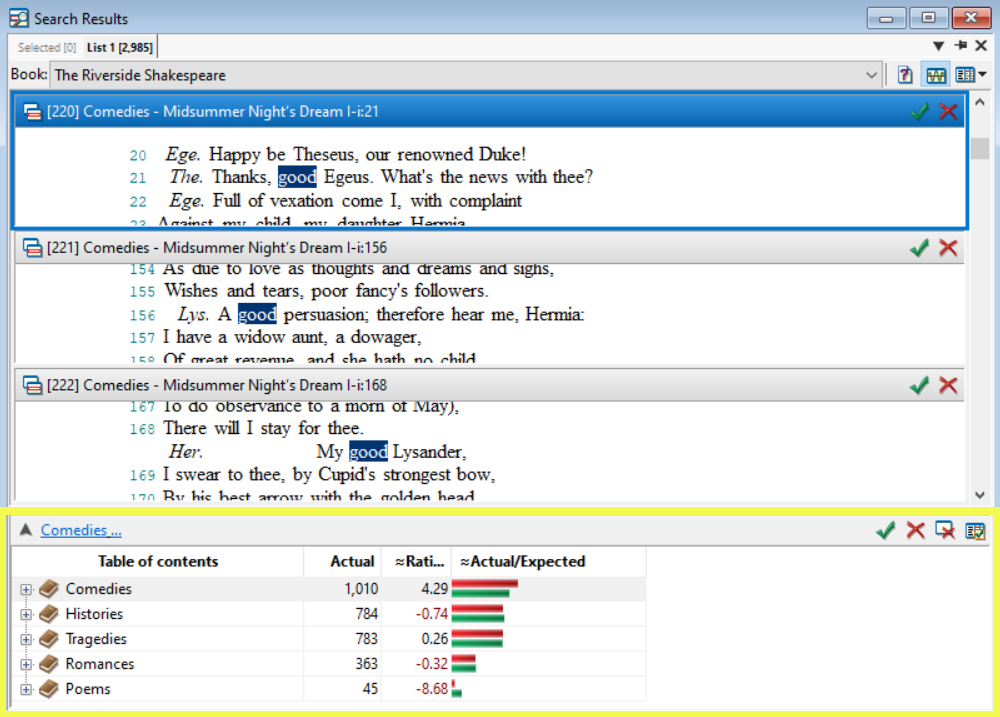
This report is found at the bottom of the results window. It lists every section of the book in which your search term appears. By default, the report will show the actual number of hits, a rating, and a comparison of the actual versus expected number of hits. This is what you might see:
Report Columns
To change the columns displayed, right-click > Show or Hide Columns. You can reorganize columns by selecting and dragging the header with the mouse.
| Column | Description | Example |
|---|---|---|
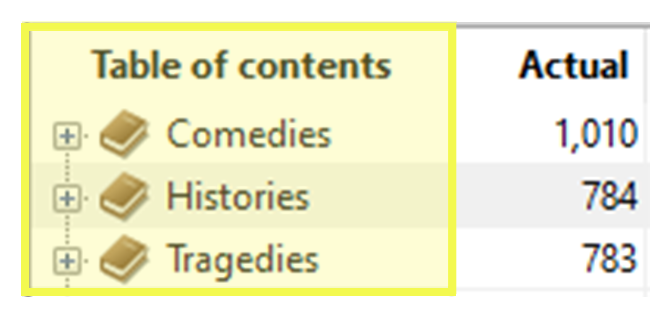
| Table of contents | A list of the references within the book. References with 0 results are not shown.
The + button will display lower references, such as chapter and paragraph. |
 |
| Actual | The frequency of the search term within the reference. | 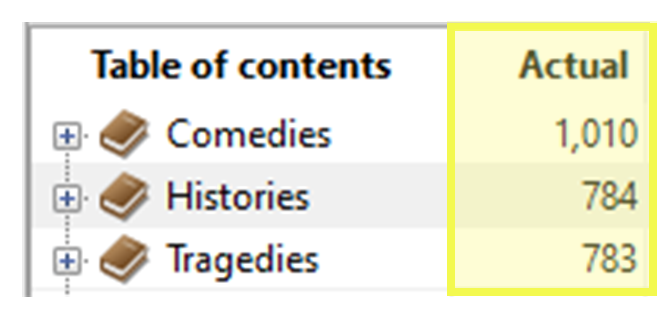 The search term occurs 1,010 times in Comedies. The search term occurs 1,010 times in Comedies. |
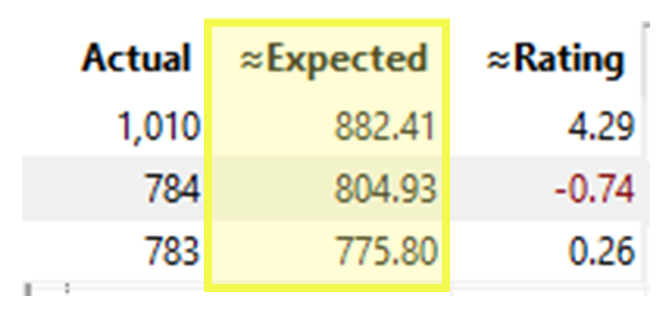
| ≈Expected | If search hits were evenly distributed throughout the book, this is the number of hits we would expect to see in a given reference. (Based on the size of the reference and the total
number of search hits.) If you have filters on your search query, the expected frequency will be inaccurate. Likewise, subwords or tagwords in your search argument will distort the statistic. There is a size variable used in the computation, and it uses the number of normal words found within a reference. Many subwords or tagwords can be associated with a single normal word, so this size variable inaccuracy will invalidate the statistic. |
 |
| Rating | This statistic has a range of -10.0 to +10.0. It quantifies the significance of the number of search hits in each reference. The rating statistic attempts to normalize the data by taking into account the size of the reference and the number of search hits found in it. Learn more about the rating column and statistics here. | 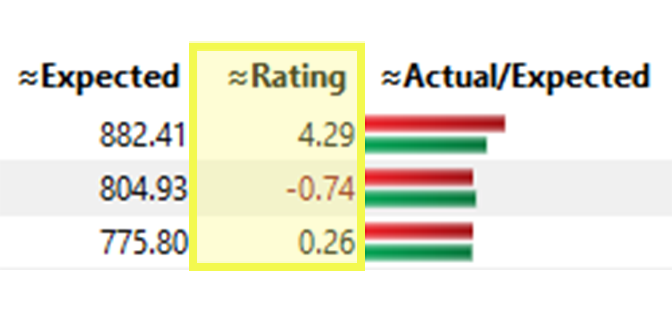 |
| ≈Actual/Expected | A bar chart comparing actual frequency (red) and expected frequency (green). | 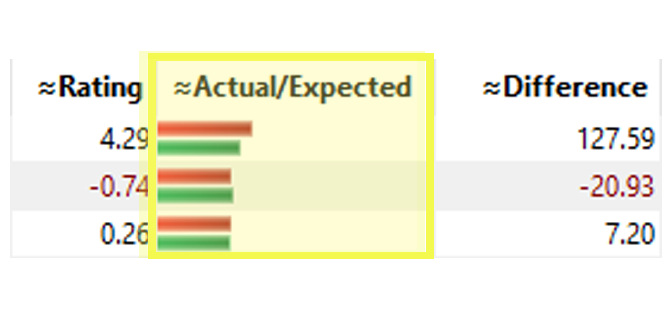 |
| Difference | Actual frequency minus Expected frequency. | 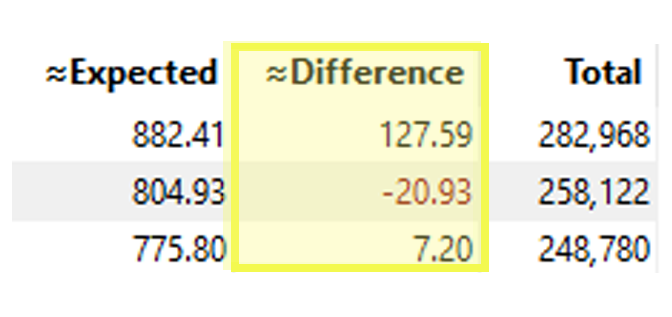 |
| Total | The total number of words within the reference. | 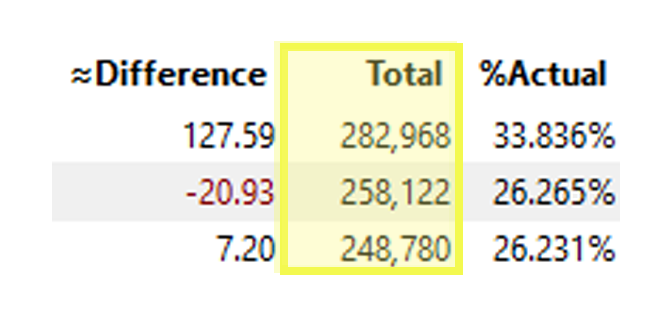 |
| %Actual | The percent of the total number of hits are found in each reference. | 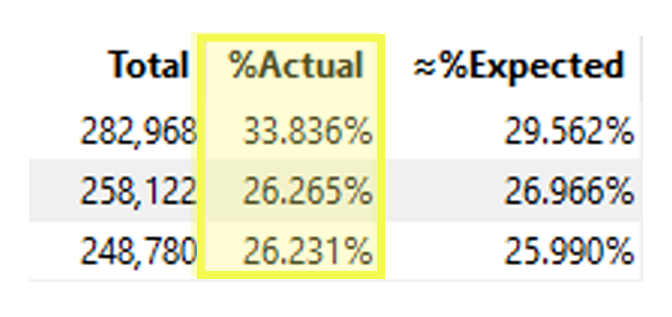 |
| ≈%Expected | The relative size of the reference, or what percent of the total text is contained in each reference. | 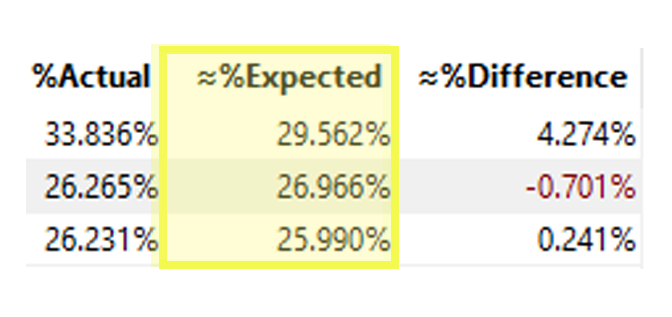 |
| %Difference | % Actual frequency minus % Expected frequency. | 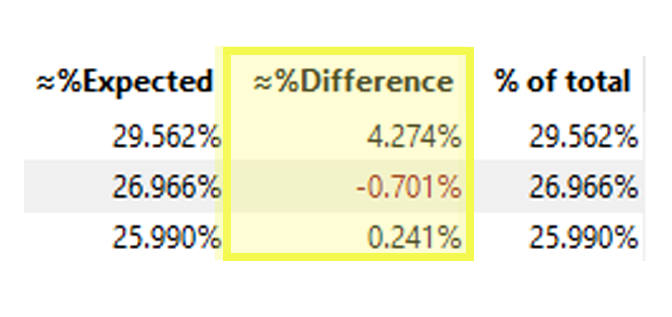 |
| % of total | The size of the reference relative to the size of the entire book. When you add up all of the percentages in this column, it should equal 100. Here, you can see that comedies are 29.562% of The Riverside Shakespeare. | 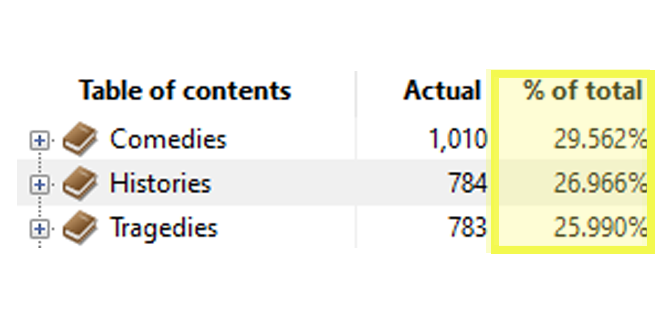 |
Save Options
To copy the selected row, right-click > Copy.
To copy all visible rows, right-click > Copy All.
To export all visible rows, right-click > Export All (Frequency Distribution).
Show Options
References without any results
You can display data on references with zero results. To do this, right-click > Frequency Distribution Preferences. Check the box next to Display all entires (including those with no hits) and click OK.
Expand references to lower levels
You can expand references to display lower levels. To do this, click the + button next to any reference level.
If you would like to display all lower level references, right-click > Show Levels > [Select 1-5 or All]
Note: Showing all levels for a book with tens of thousands of levels can make the program non-responsive.
The Rating Column
The Rating column has a value between -10 and 10. If the rating is closer to 10, the actual frequency is much higher than its expected frequency. This formula is used to calculate the rating:
\[Rating = \sqrt{(Actual-Expected)^2 \over Expected + 1}\]
This formula is similar to calculating a chi-square statistic for each cell in a table.
To avoid dividing by 0, a 1 is added to the Expected value.
Ratings greater than 10.0 are rounded down to 10.0.
Ratings less than -10.0 are rounded up to -10.0.
The expected values used in computing this rating are from Normal type words in the All Text (excluding any text from your notes).
Note: If you have filters on your search query, the expected frequency will be inaccurate.